Introduction
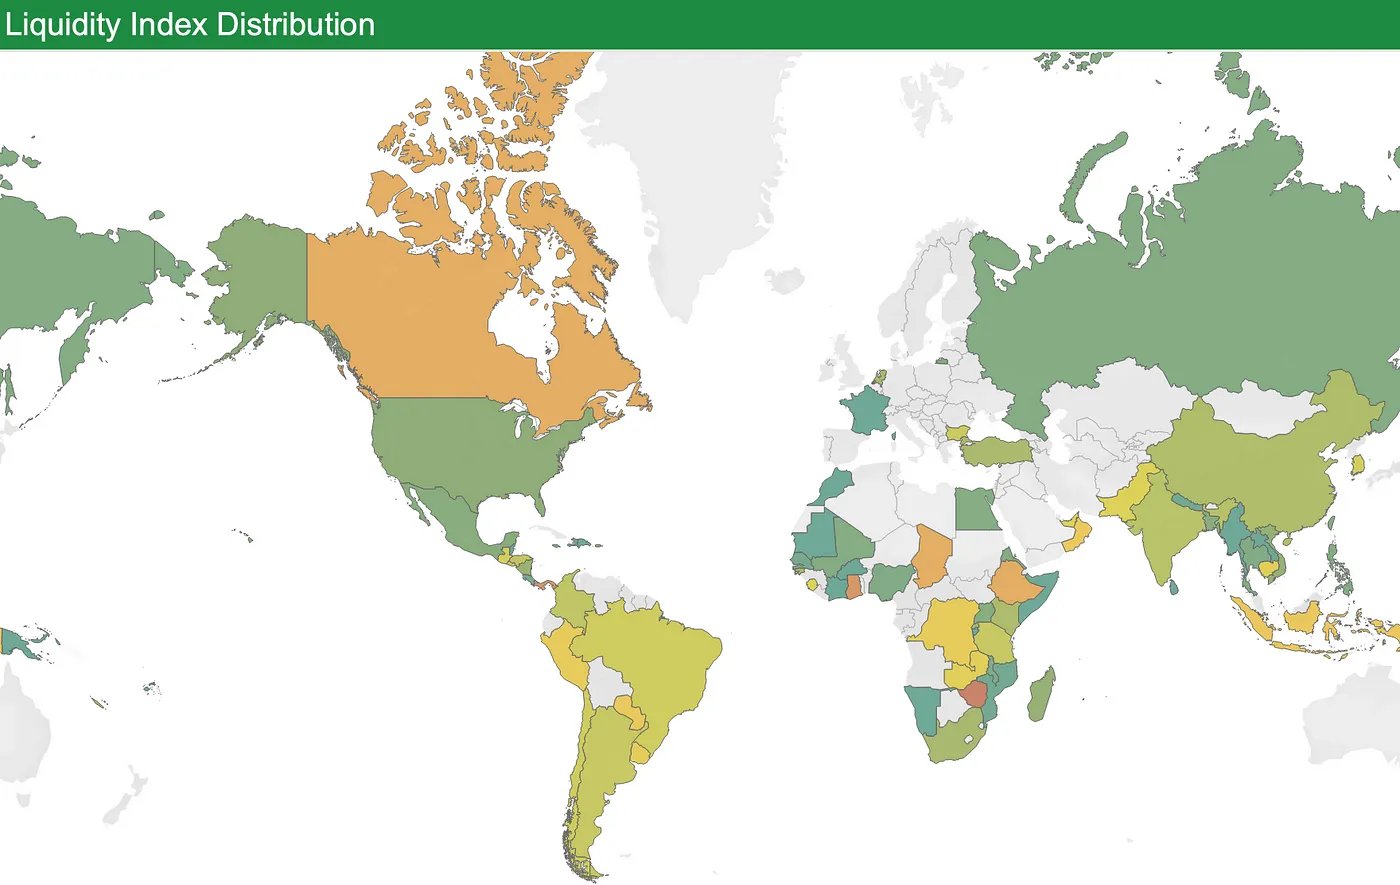
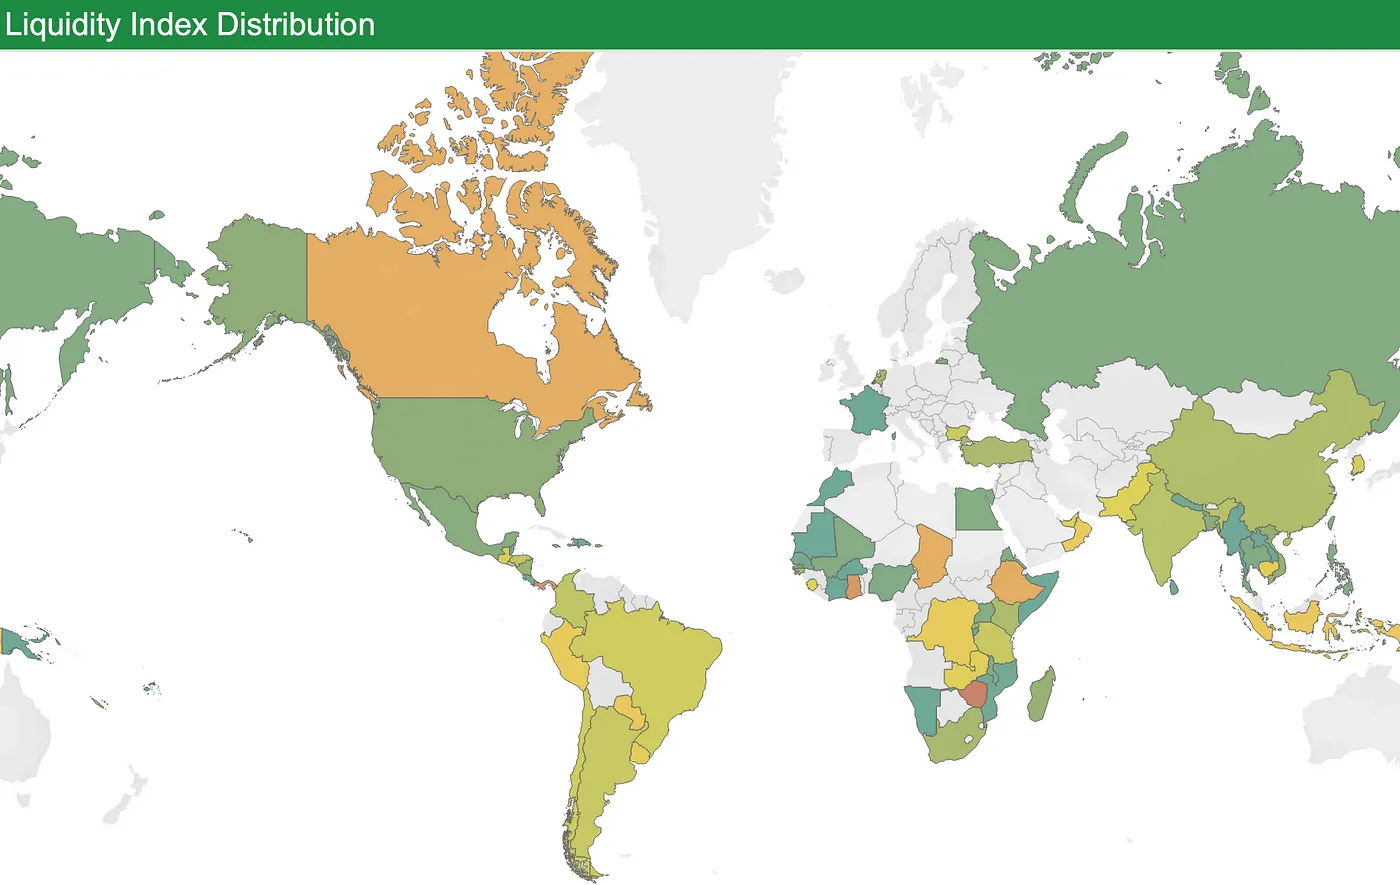
AlliedOffsets is thrilled to announce the implementation of an innovative metric of liquidity for the voluntary carbon market (VCM) on all projects in the AlliedOffsets database. This new approach aims to evaluate and rank each project’s liquidity on a scale of 0 to 10, taking into consideration various criteria related to how actively each project is traded in the VCM. Through a comprehensive analysis, we have assigned a grade to each project, enabling users to identify credits that are most easily available to purchase.
Calculating the Liquidity Level: AlliedOffsets Scoring System
To determine the liquidity for projects, a comprehensive evaluation process was conducted. Multiple attributes were considered, and each was assigned a weight. The attributes and their corresponding weights are as follows:
- Attribute 1 (Retirements Last Twelve Months (LTM)): 10% weight
- Attribute 2 (Distinct Retirements LTM): 5% weight
- Attribute 3 (Distinct Buyers): 5% weight
- Attribute 4 (Distinct Brokers): 10% weight
- Attribute 5 (Number prices Received by AlliedOffsets from various sources LTM): 20% weight
- Attribute 6 (Issuances Last 5 years): 10% weight
- Attribute 7 (Total Ratings from any of six rating agencies): 10% weight
- Attribute 8 (Retirements Last 3 months): 20% weight
- Attribute 9 (Is the latest vintage within the last 3 years): 10% weight
Each attribute was given a percentile and then combined with the weighted attributes as mentioned above, following which a weighted percentile score score was obtained for each project. The scores were then again transformed into percentiles. The final liquidity level of 7, 8, 9, or 10 is given according to the criteria as indicated in the section below. This percentile transformation ensured that the grades were distributed evenly across the projects, allowing for a fair representation of their activity levels.
Not all projects have had issuances or retirements in recent years, meaning the above criteria applies only to the most active projects in the market. Those that have less activity are treated differently — read on below!
Understanding the Market Liquidity Levels
We have devised a detailed set of criteria that covers a broad spectrum of indicators. Each criterion represents an essential aspect of the project’s environmental impact and potential for sustainability. Let’s delve into the liquidity level scale and the associated descriptions.
Liquidity Level 0: Nothing Retired in Past 2 Years
Projects in this category have not retired any credits within the past two years. This could mean that there has been no recent market interest in a project, or that the project has only recently issued credits.
Liquidity Level 1: Nothing Retired in Last Twelve Months (LTM), but in Year Before That
Projects in this category did not retire any credits within the last twelve months but have shown some activity in the year preceding that period. This may indicate projects that have come to a close or have lost market interest.
Liquidity Level 2: Retirements LTM is Less Than 10k
Projects in this category have retired credits within the last twelve months, but the total retirement volume is less than 10,000 credits. These projects may be small or have modest market engagement.
Liquidity Level 3: Retirements LTM is Less Than 20k
Projects in this category exhibit a slightly higher level of activity, with retirements in the last twelve months reaching up to 20,000 credits.
Liquidity Level 4: Retirements LTM is Less Than 50k
Projects in this category have retired credits totalling less than 50,000 within the last twelve months.
Liquidity Level 5: Retirements LTM is Less Than 100k Credits, and (Unique Retirement Corporates <= 2 and Active Brokers <= 2)
Projects in this category have retired credits amounting to less than 100,000 within the last twelve months. Additionally, they have engaged only with a limited number of unique retiring buyers and active brokers.
Liquidity Level 6: Retirements LTM of Less Than 100k
Projects in this category have retired credits totalling less than 100,000 within the last twelve months, but have been traded by more than two brokers or retired by more than two companies.
Liquidity Level 7: AlliedOffsets Scoring System Lowest 25th Percentile
Projects in this category have undergone a comprehensive evaluation using AlliedOffsets’ scoring system. Their performance falls within the lowest 25th percentile when compared to other projects.
Liquidity Level 8: AlliedOffsets Scoring System 25th-50th Percentile
Projects in this category have achieved scores that place them within the 25th to 50th percentile range in AlliedOffsets’ scoring system.
Liquidity Level 9: AlliedOffsets Scoring System 50th-75th Percentile
Projects in this category have achieved scores that place them within the 50th to 75th percentile range in AlliedOffsets’ scoring system.
Liquidity Level 10: AlliedOffsets Scoring System 75th-100th Percentile
Projects in this category have achieved scores that place them within the 75th to 100th percentile range in AlliedOffsets’ scoring system.
Conclusion
AlliedOffsets’ new Liquidity Index system provides a comprehensive evaluation framework for assessing a project’s market activity and engagement. By assigning liquidity levels ranging from 0 to 10, based on various criteria and the AlliedOffsets scoring system, with this stakeholders can gain valuable insights into how liquid the project is.
It’s important to note that our focus in this has been on assessing the level of active trading for a particular project, rather than conducting comprehensive project evaluations. While project evaluations encompass a broader scope, liquidity analysis plays a crucial role in assessing the level of active trading for a specific project. By examining liquidity, traders and investors can better understand the market dynamics, make informed decisions, and capitalise on the opportunities presented within the project.
