2025 has seen a turbulent start for carbon dioxide removal (CDR). The Trump administration is rolling back many of the promises made in the previous four years, while purchasing activity and investor appetite have been disappointing.
Against this demand-side backdrop, we take stock of how the direct air capture (DAC) part of the market has developed to date, and how the supply side of the market has performed in the last few years. The data in this blog comes from our collaboration with the Direct Air Capture Coalition, for more details, check out our Deployments map here.
Direct Air Capture (DAC) Data Summary
The database on which the map is built contains 165 DAC developers, split between solid, liquid and electrochemical DAC.
Around $2.3 Billion has been invested in DAC firms, which is roughly 30% of total private sector equity investments in CDR. There were 152 unique Investors for DAC firms.
There are currently 30 DAC developers with offtake agreements in place. The total offtake purchase volume is 2.5 Million tCO2 from 78 unique buyers. The estimated average price is $443.28, which was aggregated from multiple marketplaces, registries, RFPs and buyers.

Overview of the DAC Data
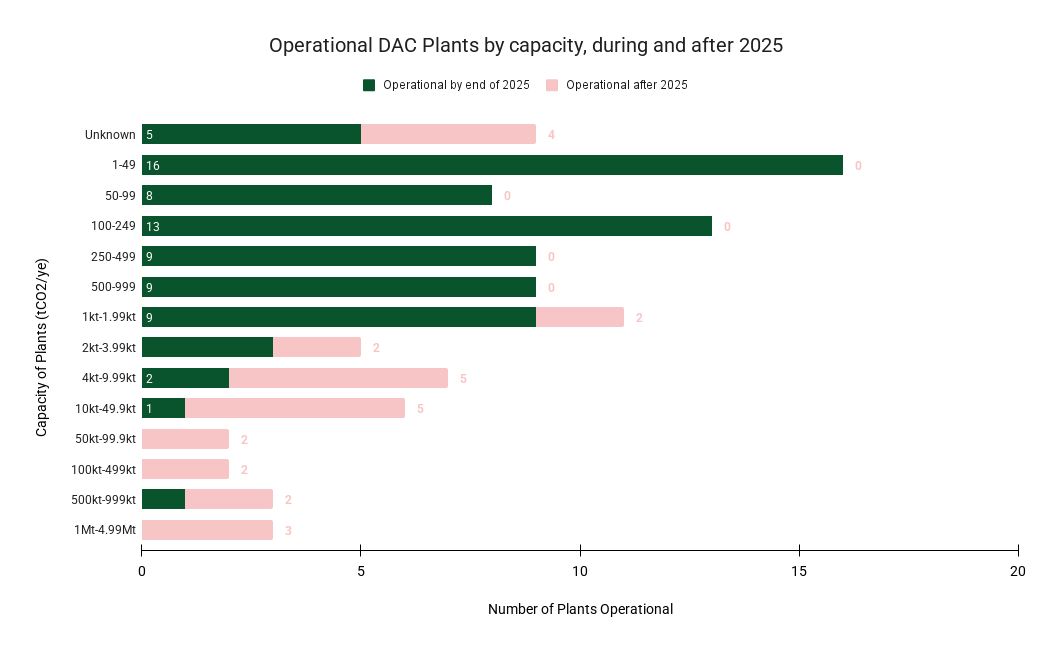
84 DAC plants (combined pilots and commercial facilities) are expected to be operational by the end of 2025, with a combined capacity of 569 ktCO2/yr. By 2032, companies anticipate 114 facilities to be operational, with a combined capacity of 2.1 - 5.4 MtCO2/yr.
In our initial data collection phase in 2024, the projected removals were expected to be 8.1 Mt CO2/yr. However, when we refreshed the data in 2025, we found that two key projects - Carbon Engineering's Dreamcatcher project with Storegga and CarbonCapture Inc.'s Project Bison had been canceled. Together, these projects were expected to contribute 6 Mt CO2/yr, significantly impacting the overall removal capacity projections.
That said, it’s not all bad news.The number of DAC facilities grew from 92 to 114, showing that despite some cancellations, many projects are progressing and driving market expansion.
.png?width=1004&height=622&name=Global%20Capacity%20per%20year%20vs%20Facility%20Operational%20(1).png)
2025 - A Boom in the DAC Market
2025 is poised to be a big year for DAC. Global DAC capacity is projected to rise by 873%, from 59 ktCO2/yr in 2024 to 569 ktCO2/yr in 2025, driven by the anticipated launch of 1PointFive’s Stratos (500 ktCO2/yr), which will be the world's largest DAC plant to date.
Until the end of 2024, Climeworks’s Mammoth accounted for approximately 69% of global DAC capacity. However, with Stratos coming online in 2025, this single plant will account for 88% of cumulative DAC capacity.
Post 2025, an additional 30 DAC announced facilities are expected to become operational. It is evident that all the plants that become operational post 2025 are kiloton plants highlighting that DAC commercial scale is expanding at an above-average rate.

DAC: Regional Analysis
DAC activity is concentrated in North America and Europe, with 517.7 ktCO2/yr and 46.9 ktCO2/yr projected to be captured by the end of 2025, respectively. 36 plants are operational in North America and 37 in Europe, with the leading countries being the US, Canada, UK, Netherlands and Germany. By 2030, North America is projected to have 54 facilities, and Europe 47.
North America has already surpassed Europe in CO2 capture capacity and is expected to widen the gap by 2030. By then, North American facilities are projected to capture 20 times more CO2 than those in Europe.

.png?width=888&height=550&name=2030%20Regional%20Capacity%20MtCO2_ye%20vs%20Region%20(1).png)
An Overview of DAC subtypes
The table below provides a comparative analysis of the different types of DAC. High-temperature regeneration is projected to remove the most CO2 post-2025, despite having a smaller number of facilities, indicating a larger scale per project. In contrast, low-temperature DAC, with the most facilities, is expected to remove less CO2, suggesting a lower per-site capacity. Electrochemical DAC, though emerging, has the lowest removal projections.

Notable Mentions: DAC Facilities
Among the largest planned DAC facilities, 1PointFive is set to lead with the South Texas DAC Hub (1 Mt CO2/yr) and Stratos (500 kt CO2/yr), totalling 1.5 Mt CO2 removal capacity.
Similarly, Carbon Engineering’s portfolio, including the Norway Project (1 Mt CO2/yr), Nuclear DAC at Byron Station (250 kt CO2/yr), and the Air to Fuels plant (250 kt CO2/yr), also totals 1.5 Mt CO2/yr.
Climeworks and Heirloom are jointly developing Project Cypress (1 Mt CO2/yr), while Capture6 is also making a significant impact with Project Octopus (500 kt CO2/yr).
In terms of the number of facilities, Skytree is expected to lead with 12 sites, followed by Climeworks (9), DACMA GmbH (8), and AirCapture (7). Companies such as Carbon Engineering and Capture6 are also actively expanding, each projected to operate 5 facilities.
This distribution highlights a mix of large-scale hubs and a growing number of smaller, distributed DAC operations, reflecting both centralised and modular approaches to carbon removal.
1PointFive and Carbon Engineering emerge as the frontrunners in large-scale DAC removal, with 1.5 Mt CO2/yr each from their respective projects.
The Current DAC Landscape: A Summary
In summary, the global investment in DAC technology surged, leading to 114 DAC facilities being announced worldwide and 84 aiming to be operational by the end of 2025. North America and Europe emerge as key regions of DAC activity.
Looking forward, exponential growth in DAC capacity seems to be on track with the 67% annual increase each year. However, the scale needs to increase significantly to align with net-zero targets.
AlliedOffsets contains the world’s largest dataset on voluntary carbon markets, including CDR. If you are interested in learning more about our data please reach out.
Note: This analysis does not include Direct Ocean Capture (DOC) as we have categorised it separately in our taxonomy. The figures presented here focus solely on DAC.