Our Pricing and Activity page continues to evolve, giving users clearer, more transparent insight into how carbon credit prices develop over time.
Consistent growth in price inputs
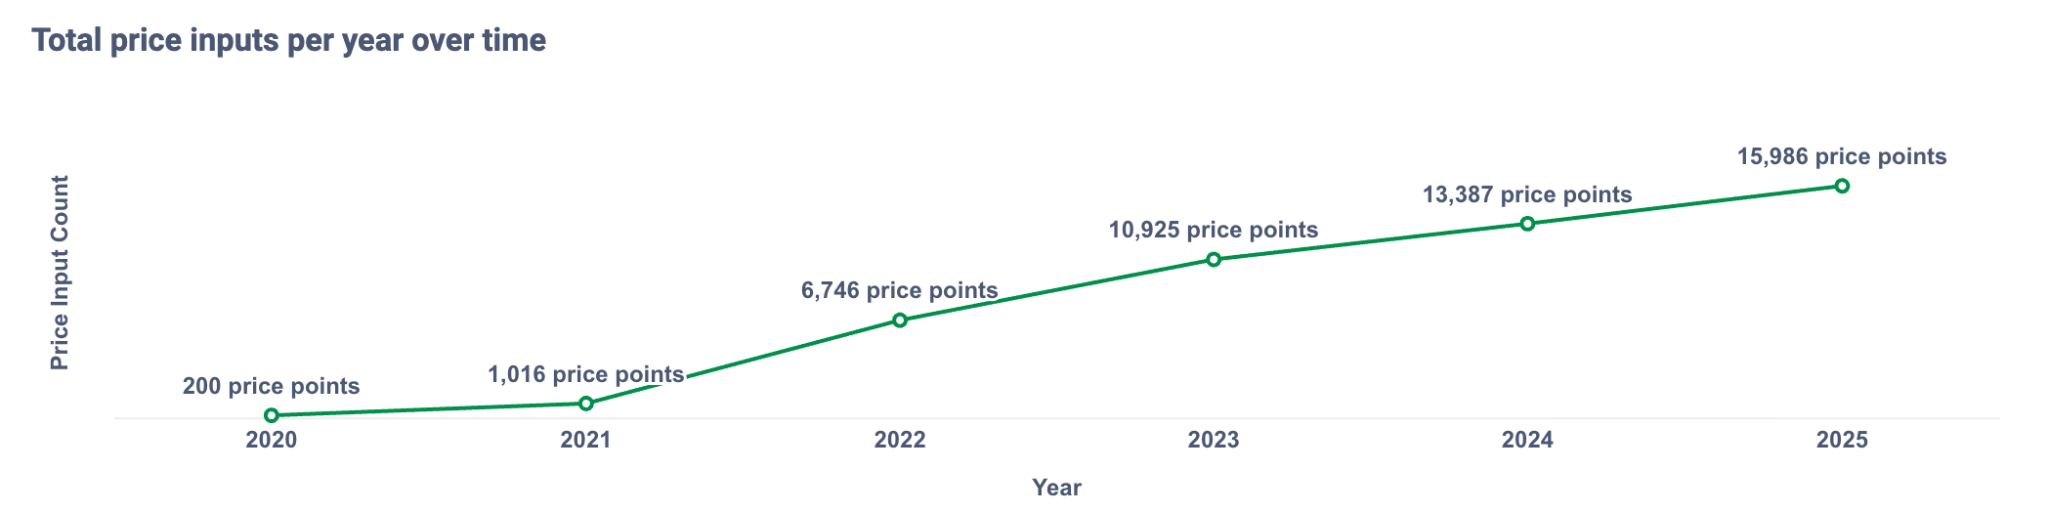
The number of price inputs on the AlliedOffsets platform has grown steadily year-on-year, from 200 in 2020 to nearly 50,000 in 2025. This reflects both the maturing of the voluntary carbon market and the increasing depth of data captured across projects and transactions.

Total Price Inputs Per Year Over Time
Over the past 12 months, we’ve recorded more than 17,000 price inputs, averaging around 1,400 per month. These data points come from 1,177 unique projects across 81 countries, showing the scope and diversity of market activity tracked.
Comprehensive Price Estimation
Our price estimation coverage now spans 35,000+ projects and nearly 600,000 transactions, offering one of the most comprehensive views of pricing activity across the voluntary carbon market (VCM).

Fantasy Carbon Trading League S3
If you want to go beyond dashboards and experience how this pricing data plays out in practice, you can now join our Fantasy Carbon Trading League Season 3!
Trade carbon credits using real project data, live prices, and our Quality Normalization tool to help identify higher-quality credits.
We’ve also added a new interactive video to the pricing & activity page, walking you through how to:
- Explore different market segments
- Apply filters across project attributes and quality metrics
- Track how prices evolve over time