
.svg "logo")
-1.jpg)
Looking at corporate and public sector retirements matched to a buyer, US entities have retired 429.2 million credits, against 127.1 million for buyers headquartered in the United Kingdom.
That is a 3.4x gap in volume. What makes it interesting is that the gap in participation is almost nothing: 3,236 US buyers against 2,877 UK buyers. Two markets with a similar number of active companies are retiring very different quantities of credits, and the reasons why say a lot about how demand is likely to develop in each.
How big is the US carbon market compared to the UK?

The clearest way to read the gap is per buyer. The average US buyer has retired roughly 133,000 credits. The average UK buyer has retired roughly 44,000. Three times the volume, from a buyer base only 12% larger.
US buyers also pay a premium for it, at around 19% more per credit. The project mix behind those retirements is the main reason why.
Energy leads both markets as the top buyer sector, but that is where the similarity stops. In the US, energy sits alongside airlines, agriculture and technology in a relatively even spread. In the UK, energy accounts for half of all retirements on its own.
Which sectors are driving demand in each market?
Energy is the largest buyer sector in both markets, but it carries very different weight. In the UK it accounts for 50.2% of all retirements. In the US it accounts for 24.6%, sitting alongside airlines at 16.1%, agriculture and aquaculture at 9.1%, financial services at 6.5% and technology and telecommunication at 6.2%.
Retirements by buyer sector, US vs UK
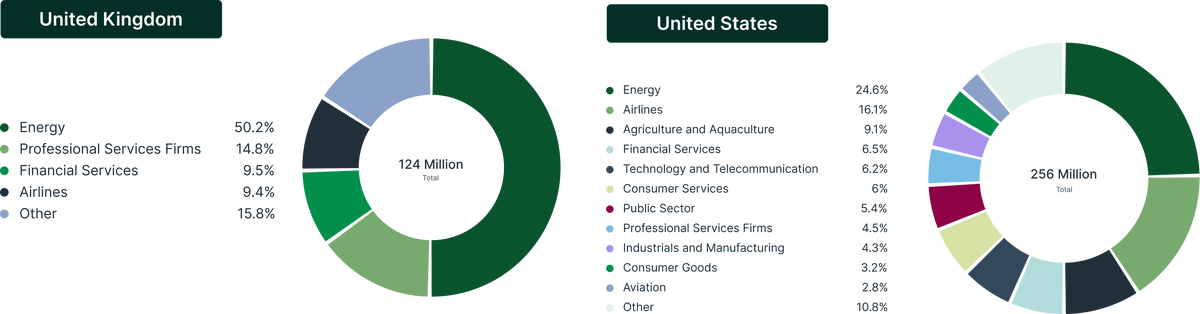
The US spread is the widest of the two by some distance. Eleven named sectors each hold at least 2.8% of volume, and no single one reaches a quarter of the market. The UK resolves into four: energy, professional services at 14.8%, financial services at 9.5% and airlines at 9.4%, which together account for 84% of retirements.
That difference in composition also shows up in price. US buyers are retiring a project mix weighted more toward carbon capture and industrial project types, while UK buyers sit further toward renewable energy and household device credits, which helps explain the 19% premium US buyers pay per credit.
Who are the biggest carbon credit buyers in the US?
Microsoft sits well clear at the top of the US market with 102.8 million credits retired, two and a half times the volume of Delta Air Lines in second place on 40.5 million. LEAF Coalition is third on 21.4 million, and from there the distribution flattens out, with the remaining seven buyers clustered between 7.9 million and 15 million.
What stands out is the range of buyer types. The top ten includes two technology companies, an airline, three energy companies, a financial institution, a multi-corporate coalition in LEAF, and three Alaska Native and Native American entities in Sealaska Corporation, Ahtna Incorporated and the White Mountain Apache Tribe. That last group has no equivalent in the UK top ten and reflects the scale of land held by Native corporations in the US.
By sector, energy accounts for 24.6% of US retirements and airlines 16.1%, with agriculture and aquaculture third at 9.1%. No single sector accounts for more than a quarter of the market.
Top 10 US buyers by all-time credit volume 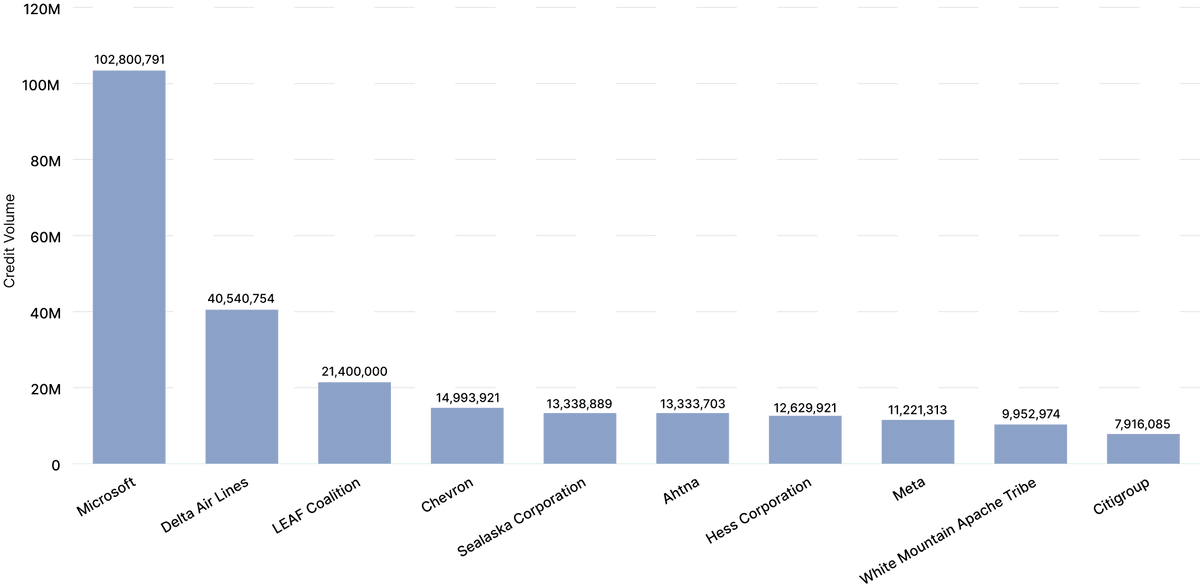
How does that compare to the UK's biggest buyers?
The UK top ten is a different set of companies doing a different job. Shell leads on 50.7 million credits, more than four times the volume of easyJet in second place on 11.1 million. EY is fourth on 5.0 million and PwC fifth on 3.3 million, both ahead of BP. HSBC, Barclays and Chanel all appear in the top ten.
Professional services firms and banks feature prominently in the UK list and are largely absent from the US equivalent, where technology and energy dominate. EY and PwC both rank above BP individually. That gap holds at sector level too: professional services accounts for 14.8% of UK retirements against 4.5% in the US.
Top 10 UK buyers by all-time credit volume

Which market is more concentrated?
Both are concentrated, and by the numbers the UK more so on every measure.
Shell alone accounts for 39.9% of all UK retirements, against Microsoft's 24% of the US total. The UK top ten accounts for 69.7% of national volume, the US top ten 57.8%. At sector level the pattern repeats: the top four UK sectors account for around 84% of volume, while in the US no single sector reaches a quarter.
The difference is not how concentrated each market is, but who is doing the concentrating. In the US, the largest positions sit with technology companies, an airline and land-holding Native corporations. In the UK, they sit with an energy major, two of the Big Four and a group of banks.
What this means for demand
The practical implication is that both markets move with a small number of buyers, so demand forecasting in either case is a question of tracking individual companies rather than sector averages. A change in procurement strategy at Microsoft or Shell moves the national total measurably.
The UK is the more exposed of the two, with 40% of volume resting on a single buyer and half the market resting on one sector. It is also the market being shaped more actively from the top down. The government has published six principles for voluntary carbon and nature market integrity and consulted on how to implement them, including endorsing the VCMI Claims Code of Practice as a benchmark for corporate claims. The UK ETS Authority has separately confirmed that engineered removals will be integrated into the UK ETS from 2029, with legislation finalized by 2028 and a minimum 200-year permanence requirement.
US demand sits in a different policy environment. There is no single federal regulator with authority over the voluntary carbon market. The 2024 Treasury joint policy statement set out voluntary principles rather than rules, and disclosure requirements are developing at state level instead, most notably through California's AB 1305, which applies to any entity operating in the state with no revenue threshold. One further factor for anyone modeling US demand: the US withdrawal from the Paris Agreement took effect on 27 January 2026, and market participants expect this to limit CORSIA Phase 1 eligible supply from US projects, since corresponding adjustments fall under the Paris Agreement.
For anyone modeling demand across both markets, that is the distinction worth holding onto. The US is bigger, pays more, and spreads its volume across a wider set of sectors. The UK is cheaper per credit, more concentrated at both company and sector level, and increasingly shaped by policy.
Interested in the data behind this analysis? Every figure in this piece comes from our corporate retirements data, which matches retirements to buyer, sector, project type and price across the carbon market. To see more, book a meeting here.