One criticism of voluntary carbon market (VCM) forestry projects comes down to risk, and for good reason: there are a number of challenges in creating a viable project, and each of those carries a degree of uncertainty. How likely is it that a forest fire will burn trees? How invested is the community in the success of the project? How secure are the land rights?
Standards setting-bodies have created ways to quantify and mitigate these concerns, by enabling projects to set a score for a number of potential risks.
In short, a project that is riskier has to allocate more credits to its buffer pool, which locks away offsets in case of an unhappy outcome. A safer project needs to allocate fewer credits to the pool. Standards have their own rules for what happens after a credit has been allocated to the buffer pool: some make the credits available, once they can prove that the risk has been successfully mitigated; others do not allow credits out of the pool. Some allow projects to claim negative risk scores when the risk has mitigation strategies in place.
Verra’s latest short form documentation (file download), for example, tallies three headline types of risk:
Internal
- Project Management
- Financial Viability
- Opportunity Cost
- Project Longevity
External
- Land Tenure and Resource Access Impacts
- Community Engagement
- Political Risk
Natural (fires, typhoons, landslides, etc.)
- Significance
- Likelihood
- Mitigation
As we have been digitizing project documents, we decided to take a peek into what they claim to be their biggest risk factors, on average. We started with a sample of 28 VCS forestry projects. While it’s a fairly small sample size in the number of projects, these 28 account for 112m tCO2 retired over last decade— 55% of all VCS forestry credits retired since 2012.

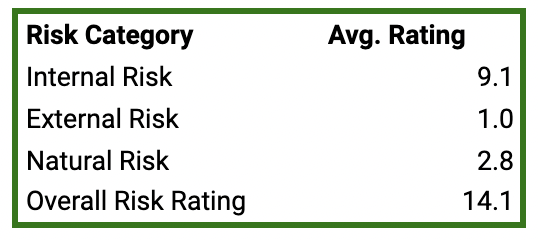
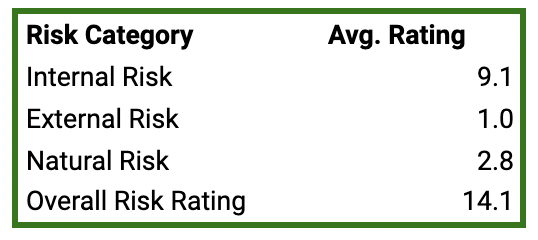
Overall, internal is by far the biggest risk for these 28 projects, followed by natural and external risks. One risk point equals one percent of credits going into the buffer pool.
A project that has a combined score of <10 in internal, external, and natural risks needs to set its overall risk to 10, according to Verra rules as we understand them, meaning a minimum of 10% of its credits go to the buffer pool. This is why the overall risk number is higher than the combined average of the three risk score components.
Two of the biggest drivers of internal risk are opportunity costs (i.e., would the land be more financially attractive to investors if it was used for other purposes) and longevity (i.e., how long does the project have before its land use tenure runs out).
As it is difficult to quantify the appetite for alternative land development, natural risk, turnover in key management roles, etc., the numbers represent the best estimate a project developer can make, given the information it has on hand at the time of writing the PDD. (Projects can also revise their risk profile in subsequent years; we have focused as much as possible on the risk reports as submitted at the start of the project’s lifecycle.) This presents an unenviable conundrum for a project developer: overstate the potential risks involved, and be penalized by having fewer issuable credits; or understate the risk, and be on the hook to allocate more credits to the buffer pool in the future, risking underdelivery to buyers.
For more data on VCM projects, check out our dashboard demo, which contains the data above and much more!
