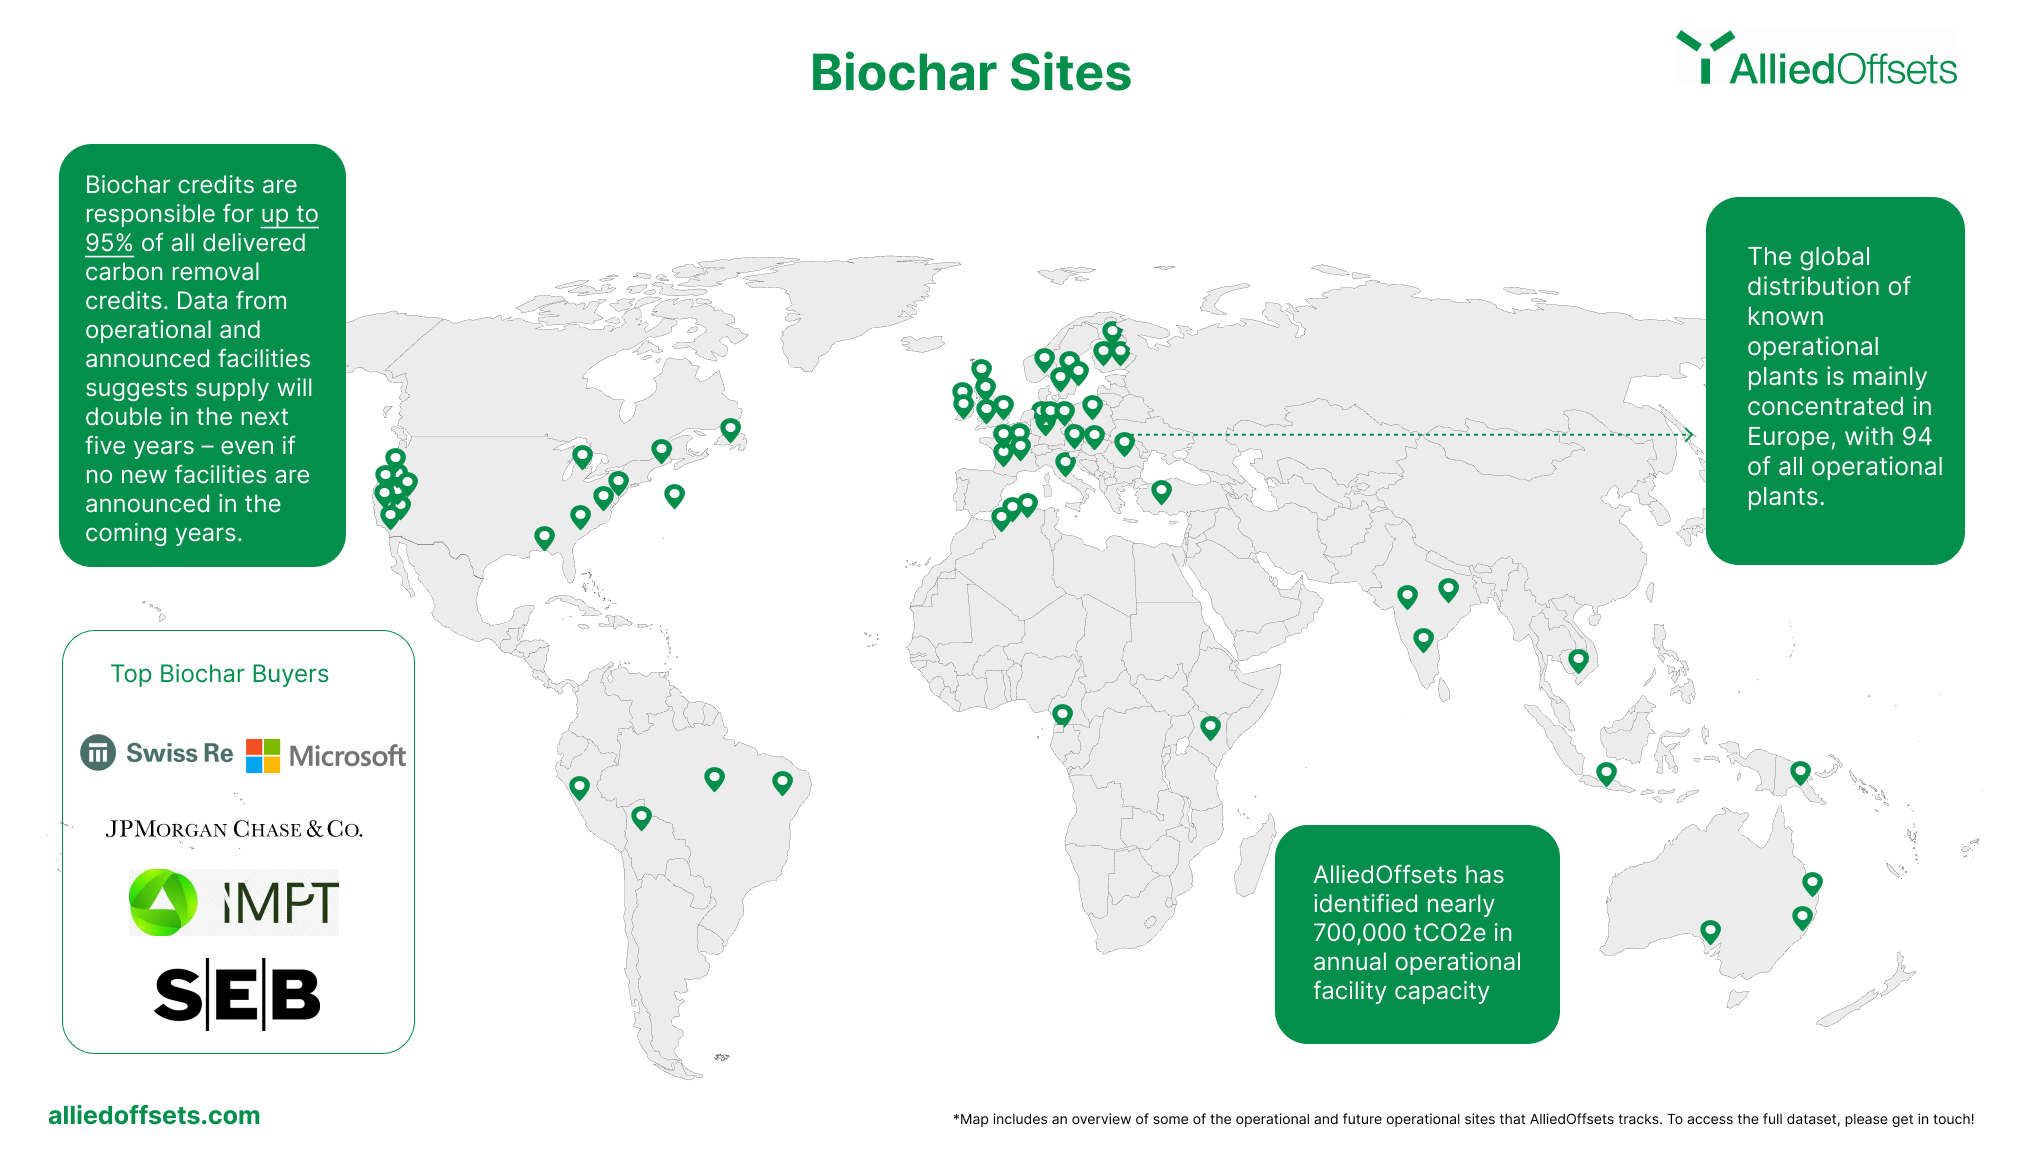
Carbon dioxide removal (CDR) is entering an important year as companies get ready to scale up their technology to meet the growing demand for carbon removals. With biochar credits responsible for up to 95% of all delivered carbon removal credits, the technology leads the way in engineered CDR.

In order to help the industry better benchmark its progress to date, AlliedOffsets has identified nearly 700,000 tCO2e in annual operational facility capacity.
Overall, data from operational and announced facilities suggests supply will double in the next five years – even if no new facilities are announced in the coming years.
The data comes from 150 biochar companies worldwide with 115 operational biochar plants The most common feedstock was woodchips.

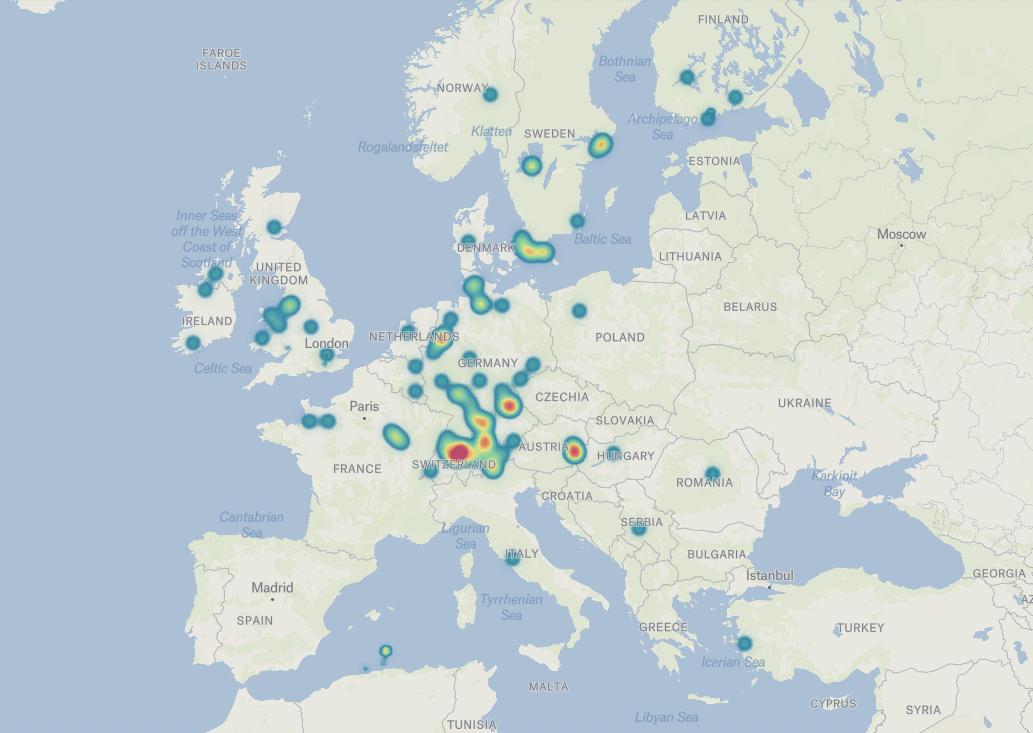
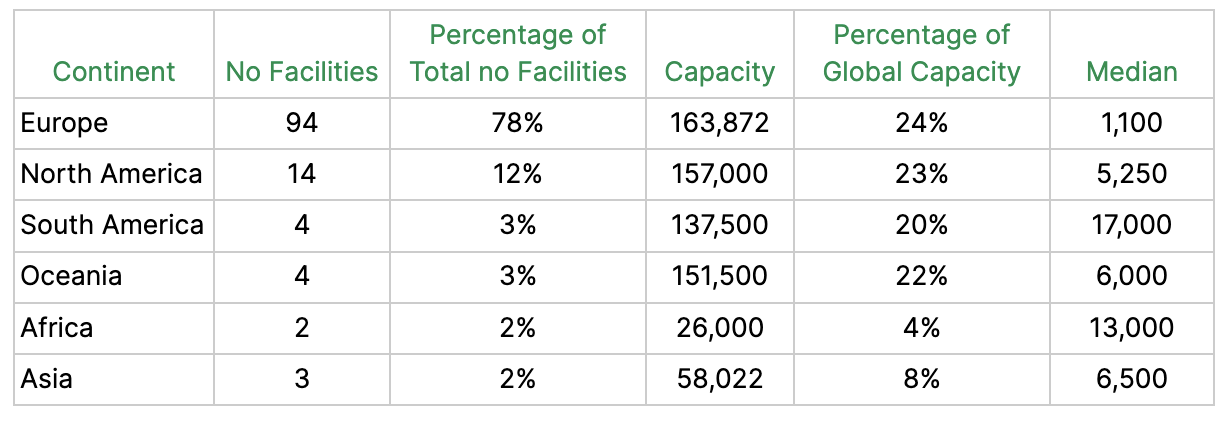
The global distribution of known operational plants is mainly concentrated in Europe, with 94 of all operational plants. In terms of global capacity, however, Europe is similar to the capacities of biochar facilities based in the Americas and Oceania, as seen in table 1.

The largest 5 plants, owned by Pacific Biofuel Holdings, Exomad Green, Carbon C2, Dutch Carboneers, and Avenger Energy account for 61% of total credit capacity, with an average capacity of 85,000 tCO2/ye.
The median of all plants, however, is 1,100 tCO2/ye and average number of plants per company is 1 which suggests that there is a lot of upcoming supply in the near future. Many of the facilities are pilots that could be expected to scale quickly due to economies of scale.
It is important to note that the median for other continents is statistically limited and 1,100 reflects a representative value for median production across continents. However, it can also be seen as a reflection of biochar production heading in two directions, artisanal and industrial production.
Instead of large industrial facilities that cost millions of dollars to create, such as Exomad Green, companies such as Dutch Carboneers use a decentralised approach. Many areas of high abundance of low cost biomass feedstock are in agricultural economies that are predominant in South America, Asia, Africa, and Oceania. Smallholder farmers in these areas will then be able to make biochar on their farms if educated and validated for carbon sequestration.
These companies collect large numbers of smallholders together and cumulatively create biochar credits, which lends itself to why we may not be seeing as many biochar plants said to be produced in the aforementioned continents, as they do not have centralised facilities that can be mapped.
Future Data & Conclusion
AlliedOffsets intends to continue updating this dataset to further characterise the biochar market. We aim to acquire more information on feedstock and suppliers in the intermediate future as well as equipment costs and general operational costs for developing biochar facilities, as our dataset for that is still statistically limited.
Overall, the future looks bright for biochar. While the current capacity of biochar is 700,000 tCO2/ye, we have data on announced future facilities, like Carbon C2’s series of plants. The company is releasing a new 81,500 tCO2/ye plant per year until 2029 in the USA, which means that, single-handedly, the company will be producing the entire of 2024’s biochar capacity in one year.